

BIT-BY-BIT TESTING

It is unlikely that one test will cover the entire application. Wouldn't it be nice to have an overview of how much was covered by each test a test suite?
MUnit Coverage feature provides metrics regarding the overall coverage of an application, resource coverage and flow components coverage. What the results actually reflect is the count of event processors executed by a set of MUnit tests. Coverage reports can be generated using Maven since MUnit 2.x. For the sake of simplicity, we will focus on generating coverage reports from Anypoint Studio.
Consider the example flow. The HTTP Listener triggers the flow by picking up a POST HTTP request. The body of the request could be empty or it could contain non-empty JSON data from which the value of the property animal would be saved into a variable by the Set Variable in the Default scope of the Choice router. The rest of the flow is less relevant for now.
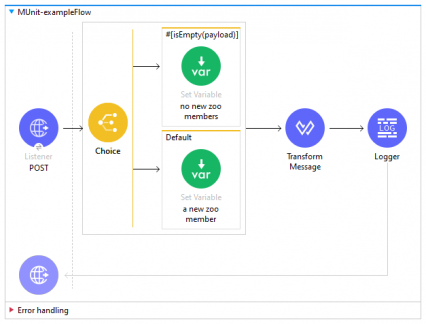
Whenever there is a Choice router in a flow, we know that the application will only one take one route. Only one of the processors within When and Default scopes will be called. The total number of processors in our example flow is 4, but only 3 will affect the application.
Let's right click on the name on the flow and select MUnit - Create blank test for this flow . Then, let's drag and drop Set Event from the MUnit module to the Execution part of the test flow (before the Flow Reference) in the newly created file. Leave the values in the Set Event's properties tab empty.
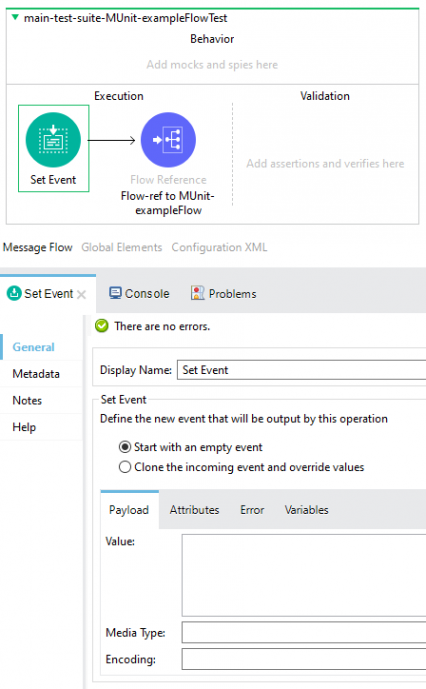
Run the test and see what happens. Only 3 out of 4 processors have been covered by this test, which is indicated by the number of the green checkmarks in the flow.

Now, let's see what happens when we set the expected body content and MIME type in the Set Event properties.
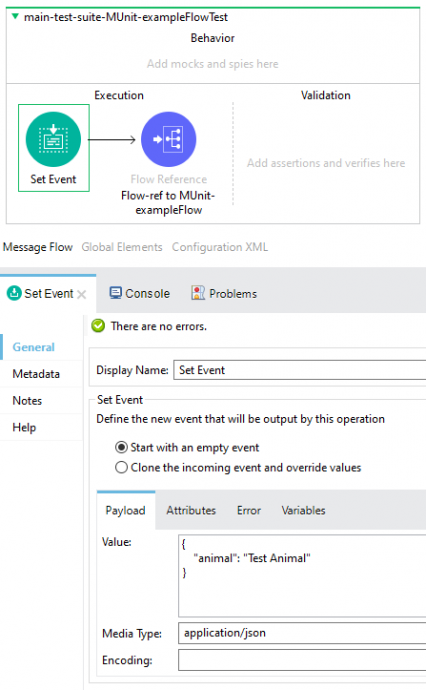
Run the test again. This time, the application took the other route. The number of the green checkmarks is 3 again, just as expected.

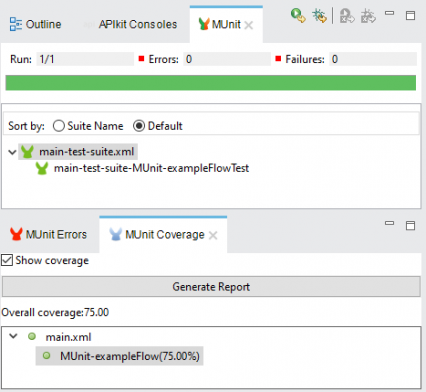
As you might have already guessed or noticed, the overall coverage in both cases is 75.00%. Please note that the Choice router was used for the sole purpose of illustrating that more than one MUnit test might be needed to test a single flow (let alone the entire application) and to achieve 100% coverage.
Coverage statistics can be found in the MUnit Coverage tab in the bottom-left corner in Anypoint Studio. If you cannot find it, go to Windows - Show View - Outline. Clicking the button will generate a nice-looking MUnit Coverage Report in HTML format.
Mule applications are generally more complex than a single flow so the report will most likely be of more help than in this example where the processors could be literally finger-counted. The goal is to test as much as possible. If a test suite results in a 100% overall coverage, the tests are well-made! For those working in large teams - a good report surely cannot create a bad rapport! Or is it vice-versa?
RELATED ARTICLES
OTHER ARTICLES
OLDER ARTICLES

LATEST FORUM UPDATES
APIAmeeth, Thursday, 1.9.2022 / 21:23
Jay-Catalyst, Tuesday, 2.11.2021 / 10:48
Matteo, Friday, 3.7.2020 / 16:30
Matteo, Friday, 3.7.2020 / 16:29
Matteo, Friday, 3.7.2020 / 16:28
Caio S Cavalcante, Friday, 22.5.2020 / 16:59
Edo Schatz, Thursday, 21.5.2020 / 13:50
Edo Schatz, Thursday, 21.5.2020 / 11:29
Edo Schatz, Wednesday, 20.5.2020 / 18:18
Edo Schatz, Monday, 18.5.2020 / 16:33
NEW ARTICLES
POPULAR ARTICLES